On This Page
Leadpages analytics shows how many people visit each page, how many convert, your conversion rate and where your traffic comes from. Every plan includes conversion and traffic-source reporting, with analytics history of 12 months on Business and Grow, 24 months on Optimize and 36 on Enterprise. Optimize adds click, scroll and attention heatmaps, and every plan includes two built-in page scores: Leadmeter while you build and the Optimization Score after publishing.
For deeper analysis across your whole website, you can also connect Google Analytics and ad platform tracking.
What Leadpages Measures
- Visitors and unique visitors per page
- Conversions and conversion rate
- Traffic sources
- Variant results for A/B tests (Grow and up)
- Heatmaps (Optimize and up)
- Page quality scores (Leadmeter and Optimization Score)
Analytics by Plan
| Feature | Pro | Business | Grow | Optimize | Enterprise |
|---|---|---|---|---|---|
| Conversion and traffic reporting | Yes | Yes | Yes | Yes | Yes |
| Analytics history | Shorter | 12 months | 12 months | 24 months | 36 months |
| A/B test reporting | No | No | Yes | Yes | Yes |
| Smart Traffic results | No | No | No | Yes | Yes |
| Heatmaps | No | No | No | Yes | Yes |
| Leadmeter and Optimization Score | Yes | Yes | Yes | Yes | Yes |
Plan details change, so check the current Leadpages pricing before choosing.
Leadmeter and the Optimization Score
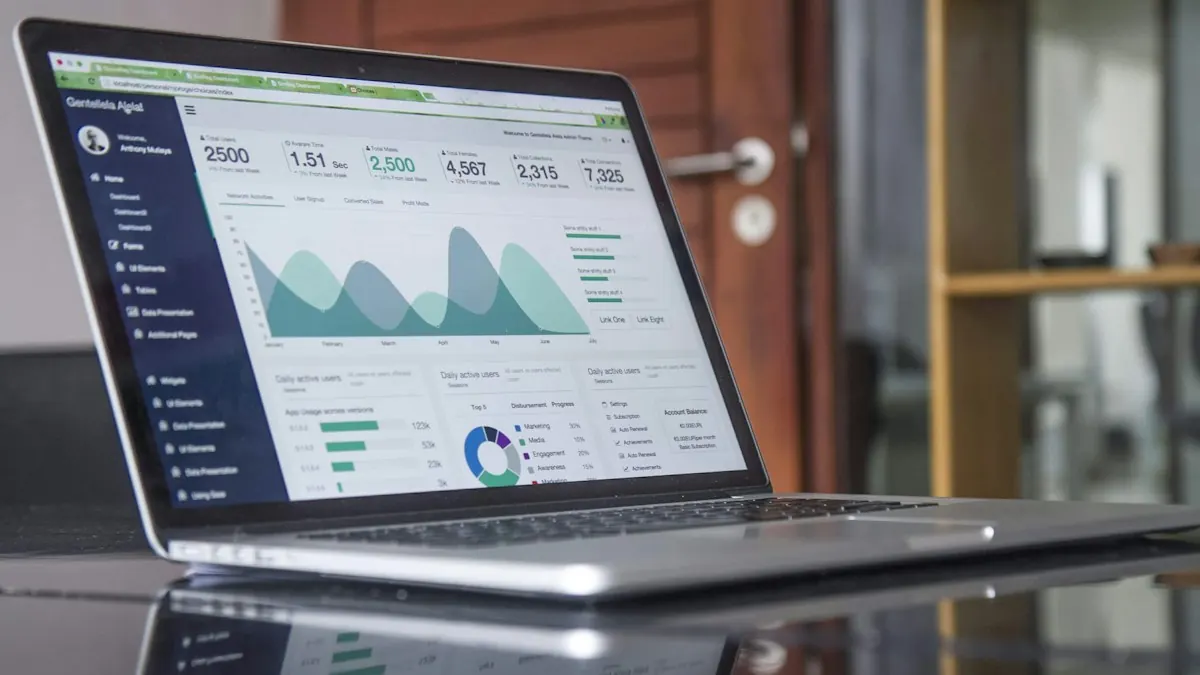
Leadpages scores your page twice.
Leadmeter grades the page while you build it, flagging things like a missing call to action, a long form or weak headline placement. The Optimization Score reviews the page after publishing and suggests improvements.
Treat both as checklists rather than predictions. A high score doesn't guarantee conversions, but the prompts catch common mistakes before you spend money on traffic.
Heatmaps on Optimize
On the Optimize plan and above, Leadpages shows click, scroll-depth and attention heatmaps inside the editor's insights panel. They answer questions numbers can't:
- Are people clicking things that aren't links, such as images or icons?
- How far down do visitors scroll before leaving?
- Which sections hold attention, and which get skipped?
Our landing page heatmaps guide explains how to read them, plus free alternatives if you're on a lower plan.
Connecting Google Analytics
Leadpages reports on each page, but Google Analytics shows the visitor's whole journey across your site. Leadpages lists Google Analytics among its native integrations, and you can also add tracking code to pages.
- Create or open a GA4 property for your website.
- Connect Google Analytics in Leadpages' integrations, or add your tag to the page settings.
- Track form submissions as key events, usually through the thank-you page.
- Use UTM parameters on every campaign link, so traffic sources are labeled correctly.
- Check real-time reports while submitting a test lead.
Our UTM parameters guide shows how to tag campaign links properly.
See visitors, conversions and traffic sources for every page, and add heatmaps and Smart Traffic on Optimize when you're ready.
Try LeadpagesAd Platform Tracking
For paid campaigns, add the Meta Pixel, Google Ads conversion tag or LinkedIn Insight Tag to the relevant pages. Leadpages' Optimize plan adds direct conversion integrations with Google Ads and Meta, which can send lead data back to the ad platforms so their bidding learns from real conversions. Our Leadpages for paid ads guide covers the setup.
What to Look At Each Week
| Metric | What It Tells You | Action If It's Weak |
|---|---|---|
| Conversion rate | How well the page persuades | Test the headline, offer or form |
| Visitors by source | Which channels send traffic | Shift budget to stronger sources |
| Conversions by source | Which channels send buyers or leads | Improve message match for weak sources |
| Variant results | Which version wins | Apply the winner, test a new idea |
| Scroll depth (Optimize) | How much of the page gets seen | Move key content and the CTA higher |
Our landing page metrics guide explains which numbers matter most for different goals.
Reading Your Leadpages Numbers
Example: Diagnosing a Drop
A webinar page's conversion rate falls from 18% to 11% in a week. The source report shows the drop comes entirely from a new Facebook campaign, while email traffic still converts well. The fix isn't the page itself: the new ad promised a "free course," while the page offers a webinar. Aligning the ad's wording with the page restores conversions.
Always check results by source before changing the page. Many apparent page problems are really traffic or message-match problems.
Analytics Across Leadpages Sites

If you build a multi-page site in Leadpages, each page reports its own visitors and conversions. Look at which pages send visitors to your main conversion page, and which pages convert directly. Our Leadpages website builder guide covers how sites work.
Exporting and Sharing Data
On Business and higher plans, you can export leads as CSV files. Combine lead exports with your CRM or sales data to see which pages produce customers, not just sign-ups. For client reporting, agencies can pair Leadpages reports with Google Analytics dashboards that show all channels together.
Limits to Know
- Lower plans have shorter history, so export data if you need long-term comparisons.
- Heatmaps require Optimize. Free tools such as Microsoft Clarity can fill the gap on lower plans.
- Lead quality isn't visible in page analytics. Track which leads become customers in your CRM or email tool.
Leadpages Analytics FAQs
Does Leadpages have analytics?
Yes. Every plan reports visitors, conversions, conversion rate and traffic sources for each page.
What is Leadmeter in Leadpages?
A built-in score that grades your page while you build it, flagging common issues such as a missing call to action.
Does Leadpages include heatmaps?
Yes, on the Optimize plan and above, with click, scroll and attention heatmaps.
Can you use Google Analytics with Leadpages?
Yes. Google Analytics is a native integration, and you can add tracking codes to pages.
How long does Leadpages keep analytics data?
Analytics history is 12 months on Business and Grow, 24 months on Optimize and 36 months on Enterprise.