On This Page
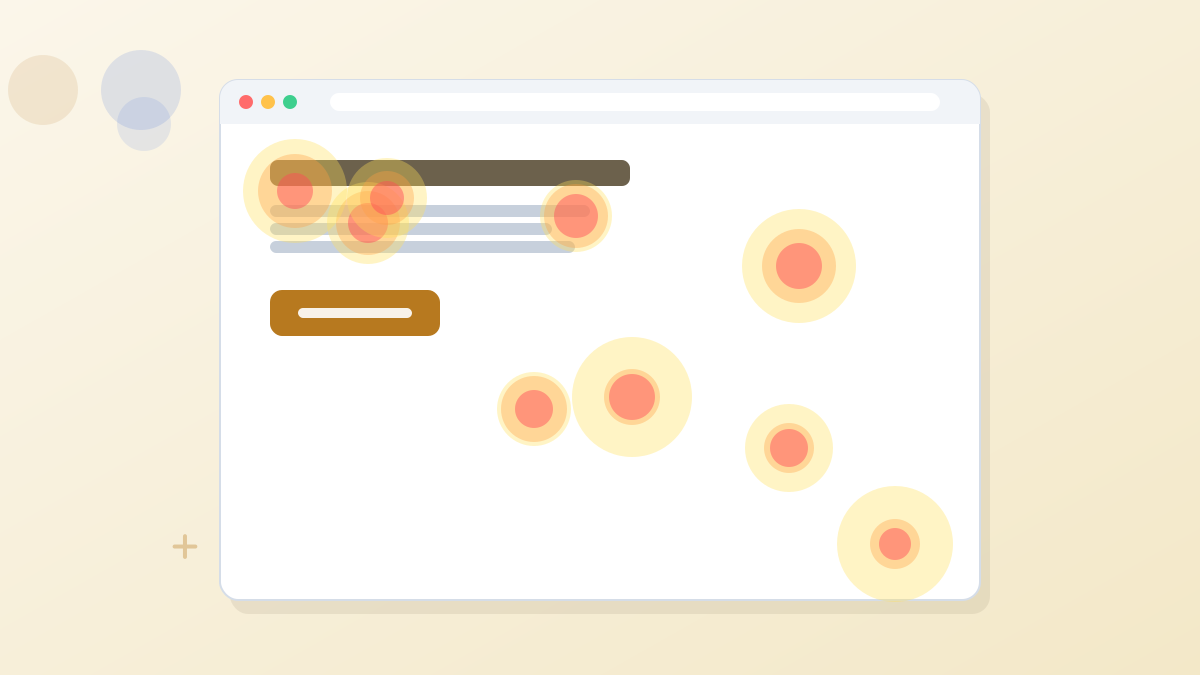
A landing page heatmap is a color overlay on your page that shows how visitors behaved: where they clicked, how far they scrolled and where their attention concentrated. Warm colors mean more activity; cool colors mean less. Heatmaps are most useful for diagnosing why a page underperforms, such as a form nobody scrolls far enough to see or a non-clickable image people keep clicking.
They don't tell you what to change on their own. Use them to form a hypothesis, then test it.
Three Heatmap Types
Click maps: where visitors click or tap.
Scroll maps: how far down the page visitors get.
Attention maps: which sections hold visitors' focus longest.
Click Heatmaps
A click map shows every click or tap, aggregated across visitors. The question isn't just "are people clicking?" but "are they clicking what we want them to click?"
What to look for:
- Clicks on your call-to-action button, compared with clicks elsewhere.
- Clicks on things that aren't links, such as images, icons or underlined text. These show what visitors expect to be clickable, and that they're looking for more information.
- Clicks on navigation or footer links that pull visitors away from the goal.
What it might mean: if many visitors click a product image, they may want a closer look. Making it open a larger view, or adding detail nearby, could help.
Scroll Heatmaps
A scroll map shows the share of visitors who reach each point on the page. It answers a simple, important question: did people even see that section?
What to look for:
- The fold line, where the first screen ends on desktop and mobile.
- Sharp drop-offs, which suggest a section that loses people or looks like the end of the page.
- Where your form or main button sits relative to how far most people scroll.
What it might mean: if most mobile visitors never reach your form, move it higher, add a button near the top that jumps to it, or cut the content above it.
False Bottoms
A large image, a full-width color block or a lot of white space can make visitors think the page has ended. A scroll map showing a steep drop right after such a section is a classic sign of a "false bottom."
Attention Heatmaps
Attention maps show which parts of the page visitors spend the most time viewing. They combine scroll position and time to highlight where focus concentrates.
What to look for:
- High attention on your key benefits and proof, which is good.
- High attention on secondary content, such as a long story section, while the offer gets little.
- Low attention on the area around the form, which may mean people skim past it.
What it might mean: if visitors linger on your FAQ, they may have unanswered questions. Moving key answers higher could reduce hesitation.
Reading Heatmaps Without Fooling Yourself
Heatmaps are easy to over-interpret. A few habits keep you honest.
- Wait for enough data. A few dozen visits can paint a misleading picture. Look at heatmaps built from a few hundred visitors or more.
- Separate mobile and desktop. Layouts differ, so behavior differs. Always check them separately.
- Segment by traffic source if you can. Ad visitors and email subscribers often behave differently.
- Compare against conversions. Heatmaps show behavior, not success. Pair them with your conversion data.
- Turn observations into hypotheses, not conclusions, then test.
From Heatmap to Test
Here's how a heatmap observation becomes a useful experiment. The example is illustrative.
Example: A Webinar Registration Page
Observation: The scroll map shows only about a third of mobile visitors reach the registration form, which sits below the speaker bio and agenda.
Hypothesis: Moving a short form and a "Save My Seat" button above the agenda will increase mobile registrations.
Test: Run an A/B test with the form near the top for the new version, keeping everything else the same.
Measure: Registration rate, split by mobile and desktop.
Our A/B testing guide explains how to run the test fairly, and our conversion rate guide lists common fixes for each kind of problem.
Common Patterns and What They Suggest
| Pattern | Possible Meaning | Something to Test |
|---|---|---|
| Few clicks on the main button | Button not visible or not compelling | Higher placement, clearer text, more contrast |
| Clicks on non-clickable images | Visitors want more detail | Make images expandable or add detail nearby |
| Steep scroll drop after the hero | Weak opening or false bottom | Stronger subheadline, visual cue to scroll |
| Form below where most people scroll | Form is hard to reach | Move form higher or add a jump button |
| Clicks on navigation links | Distractions pulling visitors away | Remove navigation from the landing page |
| Attention on FAQ, little on offer | Unanswered objections | Address key objections earlier |
Heatmap Tools
You can get heatmaps from standalone analytics tools or from your landing page builder. Free tools such as Microsoft Clarity offer click and scroll heatmaps along with session recordings, which are useful if your budget is tight.
A built-in option saves setup and keeps heatmaps next to your test results. Leadpages includes click, scroll and attention heatmaps on its Optimize plan and above, shown inside the editor over the page itself. The same plan includes Smart Traffic and A/B testing, so you can move from observation to experiment in one place.
See where visitors click and stop scrolling, then test the fix. Leadpages Optimize includes heatmaps and Smart Traffic together.
Try LeadpagesWhen Heatmaps Aren't Enough
Heatmaps show where people go, not why. To understand motivation, combine them with other methods.
- Session recordings show individual visits, revealing confusion or hesitation.
- Short on-page surveys can ask visitors what's missing or what stopped them.
- Customer interviews uncover objections that no heatmap will show.
- Form analytics show which fields cause people to abandon.
Together, these give you a fuller picture than any single tool.
Landing Page Heatmaps FAQs
What does a landing page heatmap show?
Where visitors click, how far they scroll and which sections hold their attention, displayed as a color overlay on your page.
How many visitors do you need for a useful heatmap?
Enough for patterns to stabilize, usually a few hundred visits or more. Very small samples can be misleading.
Are heatmaps useful on mobile?
Yes, but check mobile separately from desktop. Tap and scroll maps are especially useful because mobile layouts push content further down.
Can heatmaps replace A/B testing?
No. Heatmaps help you form hypotheses about what's wrong. A/B tests tell you whether your fix actually improves conversions.
Which Leadpages plan includes heatmaps?
Click, scroll and attention heatmaps are included on Leadpages Optimize and higher.