On This Page
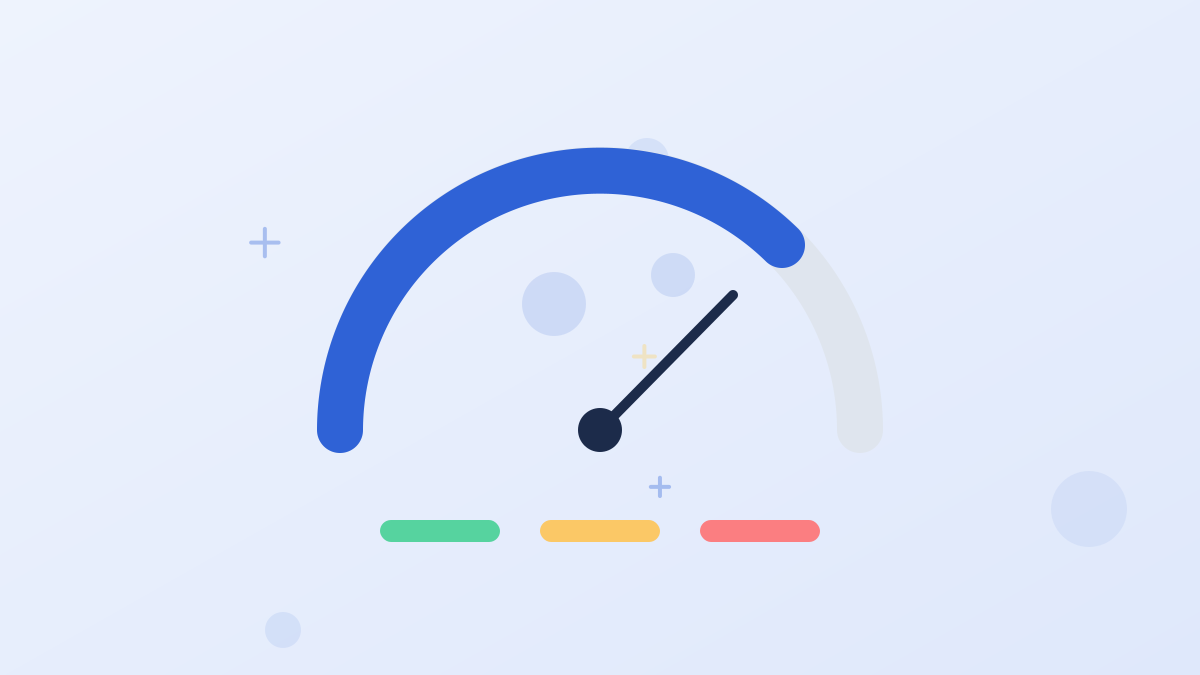
Landing page speed is how quickly your page shows its main content, responds when visitors interact and stays stable while loading. Google measures this with three Core Web Vitals: Largest Contentful Paint (LCP) should be 2.5 seconds or less, Interaction to Next Paint (INP) 200 milliseconds or less, and Cumulative Layout Shift (CLS) 0.1 or less. A page passes when at least 75% of real visits meet each threshold.
The biggest wins usually come from compressing images, cutting unnecessary scripts and keeping the first screen simple.
Core Web Vitals Thresholds
- LCP (loading): 2.5 seconds or less
- INP (responsiveness): 200 milliseconds or less
- CLS (visual stability): 0.1 or less
- Pass rule: 75% of real visits meet "good" for each
Why Speed Matters for Landing Pages
Landing pages often receive paid traffic, so a slow page wastes money before visitors read a word. Speed also feeds into Google Ads' landing page experience, part of Quality Score, and page experience is one of many signals in organic search. Most importantly, visitors on phones and slower connections simply leave when pages stall.
The Three Metrics in Plain Terms

| Metric | What It Measures | What Visitors Feel | Common Causes of Poor Scores |
|---|---|---|---|
| LCP | When the largest element on screen appears | "Is this page loading?" | Large hero images, slow servers, heavy fonts |
| INP | How quickly the page responds to taps and clicks | "Did your tap work?" | Heavy JavaScript, many third-party scripts |
| CLS | How much content jumps while loading | "The button moved!" | Images without set sizes, late-loading banners |
INP replaced an older metric, First Input Delay, in March 2024, and the thresholds have stayed the same since.
How to Test Your Page
- Run PageSpeed Insights on the live URL. It shows real-user data when enough is available, plus lab diagnostics.
- Check the mobile result first, since most landing page traffic is mobile.
- Look at the largest element flagged for LCP, often the hero image.
- Review third-party scripts listed as slowing the page.
- Test on a real phone on mobile data, not just office Wi-Fi.
Lab tests are useful for diagnosing problems. Real-user data, collected over time, is what Google uses for Core Web Vitals.
The Fixes That Matter Most
Compress and Resize Images
Serve images at the size they're shown, in modern formats where possible. This often fixes LCP on its own.
Limit Scripts
Every chat widget, tracker and embed adds weight. Keep only what you use.
Set Image Dimensions
Reserve space for images and embeds so content doesn't jump.
Avoid Heavy Hero Video
Use a lightweight image first, and load video on demand.
Use Fewer Fonts
Limit font families and weights.
Choose Good Hosting
Fast hosting with a content delivery network helps visitors everywhere.
Publish landing pages on fast hosting with free SSL and global delivery, and spend your time on the message instead of servers. Try Leadpages for 7 days.
Try LeadpagesA Speed Fix Priority List
If you're short on time, work through these fixes in order. The early ones usually make the biggest difference for the least effort.
- Replace or compress the hero image, which is often the largest element on the page.
- Remove scripts you don't use, such as old trackers or test tools.
- Delay non-essential widgets, like chat, until after the main content loads.
- Set width and height on images and embeds to stop layout shifts.
- Swap autoplay video for an image with a play button.
- Limit fonts to one or two families and the weights you use.
Lab Data Versus Field Data
Speed tools show two kinds of results. Lab data comes from a simulated test on one device and network, useful for spotting problems and checking fixes. Field data comes from real visitors over the previous weeks, and it's what Core Web Vitals assessments are based on. A page can pass a lab test but still have poor field data if many real visitors use slower phones or networks.
Third-Party Scripts
Ad pixels, analytics, heatmaps, chat widgets and review embeds each add requests and processing. Most landing pages need a few, but every script should earn its place. Review them quarterly and remove anything nobody uses.
Speed Versus Features
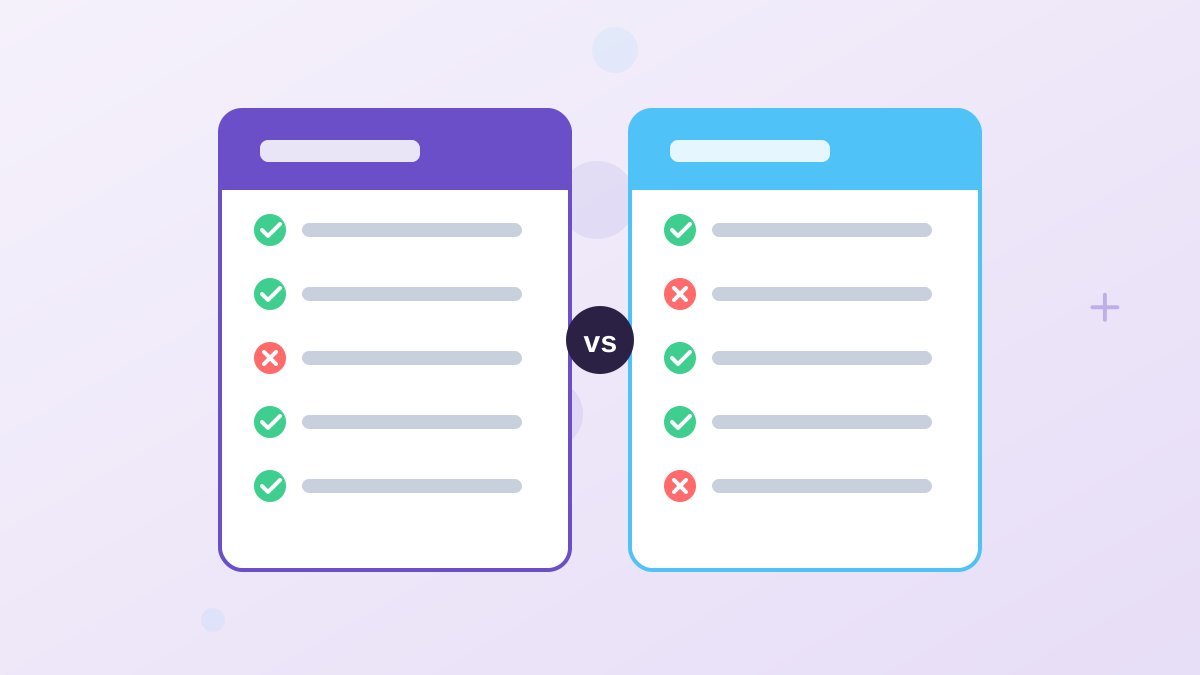
Pop-ups, video, chat and trackers can all help conversion, but each has a cost. Ask whether each element earns its place. A simpler page that loads instantly often beats a richer page that loads slowly, especially on mobile.
Speed on Landing Page Builders
Builders handle hosting and much of the technical optimization, but what you put on the page still matters. Large images, many embeds and custom scripts can slow any page. Check speed after building, and again after adding tracking codes or widgets.
Monitoring Over Time
Speed changes as you edit pages and add tools. Recheck key landing pages after significant changes, and review the Core Web Vitals report in Google Search Console for pages with enough traffic.
Landing Page Speed FAQs
What is a good landing page load time?
For Core Web Vitals, the main content should appear within 2.5 seconds for at least 75% of real visits.
What are Core Web Vitals?
Three metrics Google uses to measure page experience: LCP for loading, INP for responsiveness and CLS for visual stability.
How do you test landing page speed?
Use PageSpeed Insights on the live page, focusing on mobile results, and test on a real phone.
What slows landing pages down most?
Large images, heavy videos, too many third-party scripts and slow hosting are the most common causes.
Does page speed affect Google Ads?
Yes. Landing page experience is part of Quality Score, and slow pages also lose visitors before they convert.